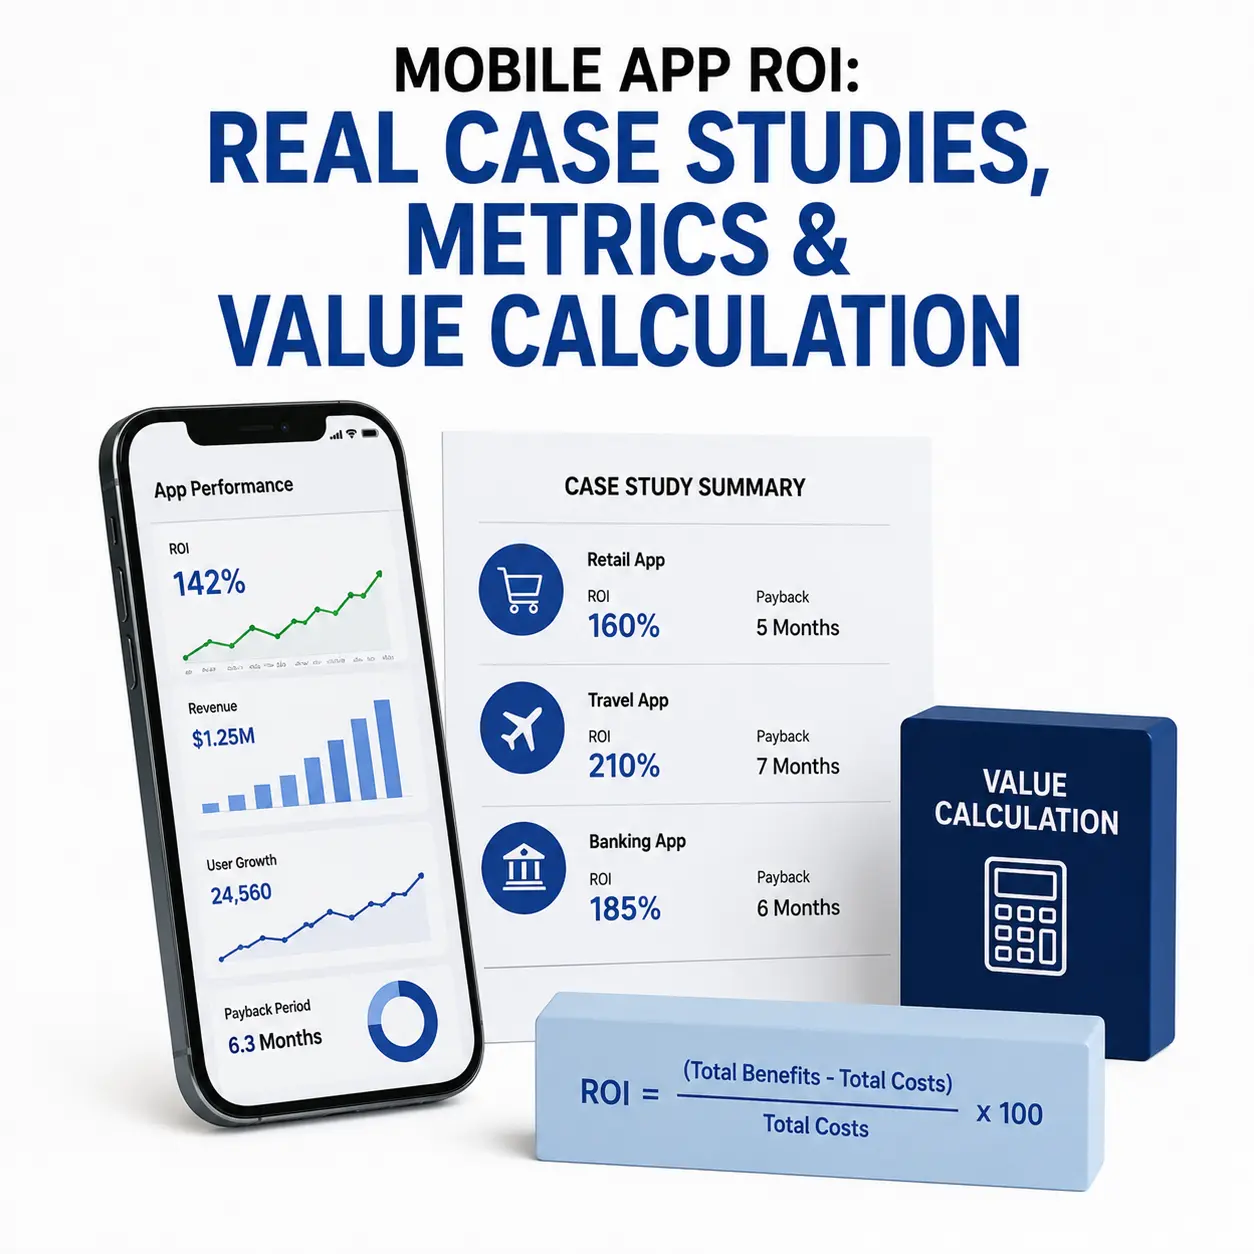
Executive boards reject vague promises of digital transformation. Calculating mobile app ROI demands clear financial formulas, accurate user acquisition data, and direct revenue attribution.
Software assets require significant capital upfront. Establishing measurable metrics long before engineering starts gives leadership complete control over budgets, payback timelines, and post-launch profitability. Before investing in an app, businesses should also understand the full development process, technology choices, costs, and implementation considerations covered in our complete guide to custom mobile app development services
Mobile App ROI Overview
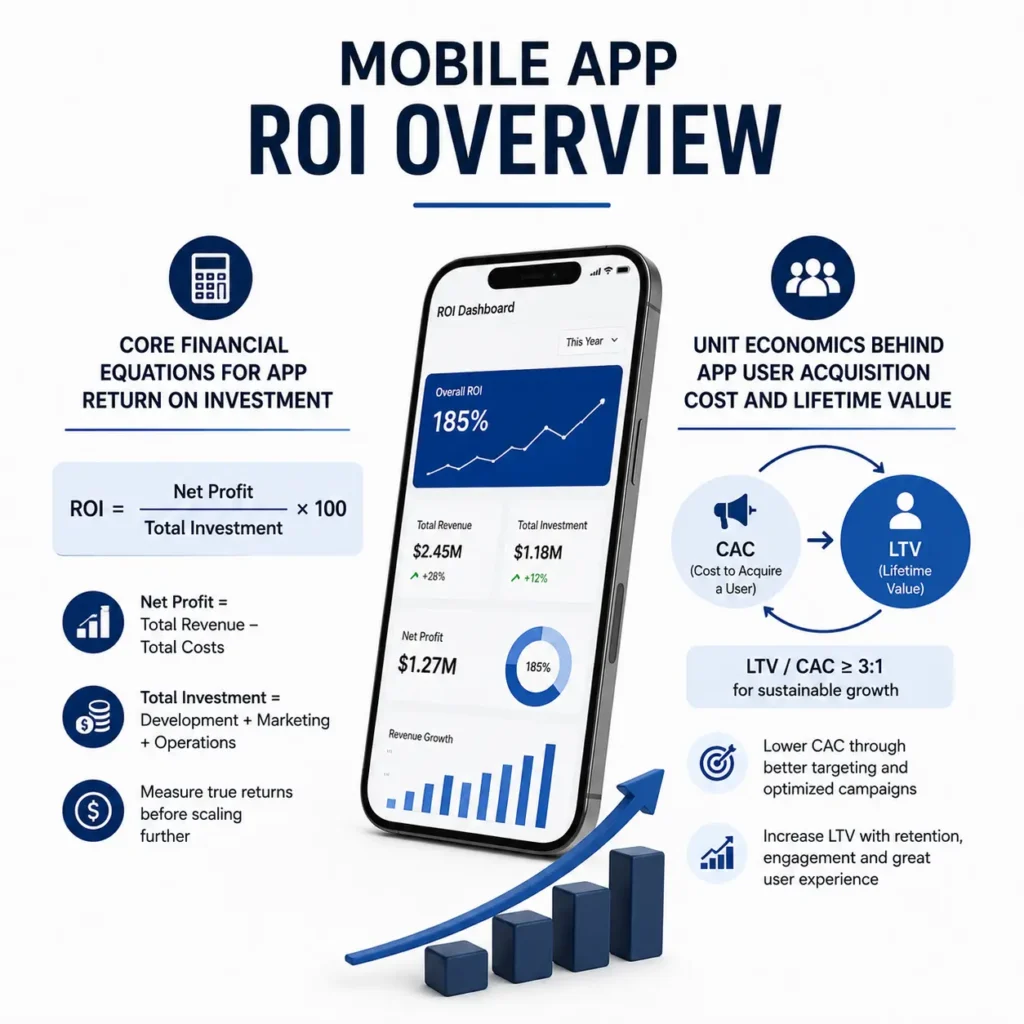
Financial analysis separates successful software investments from costly digital failures. Product teams that track hard metrics build digital products that scale sustainably.
Core Financial Equations for App Return on Investment
Net profit divided by total development expense defines basic capital efficiency. Calculating true app return on investment requires factoring initial engineering fees, cloud hosting, third-party API costs, and ongoing maintenance retainers into your capital base. Subtract overall investment costs from gross app revenue, divide that figure by total costs, and multiply by 100 to pinpoint your net gain percentage.
Unit Economics Behind App User Acquisition Cost and Lifetime Value
Sustainable mobile profits depend on maintaining a healthy ratio between marketing spend and user revenue. Your app user acquisition cost measures total ad spend divided by new organic and paid downloads. Compare this spend against app customer lifetime value, which measures total revenue earned from a single active profile over time. Healthy digital products maintain an LTV to CAC ratio of 3 to 1 or higher.
Real-World Case Studies in Enterprise Mobile App ROI
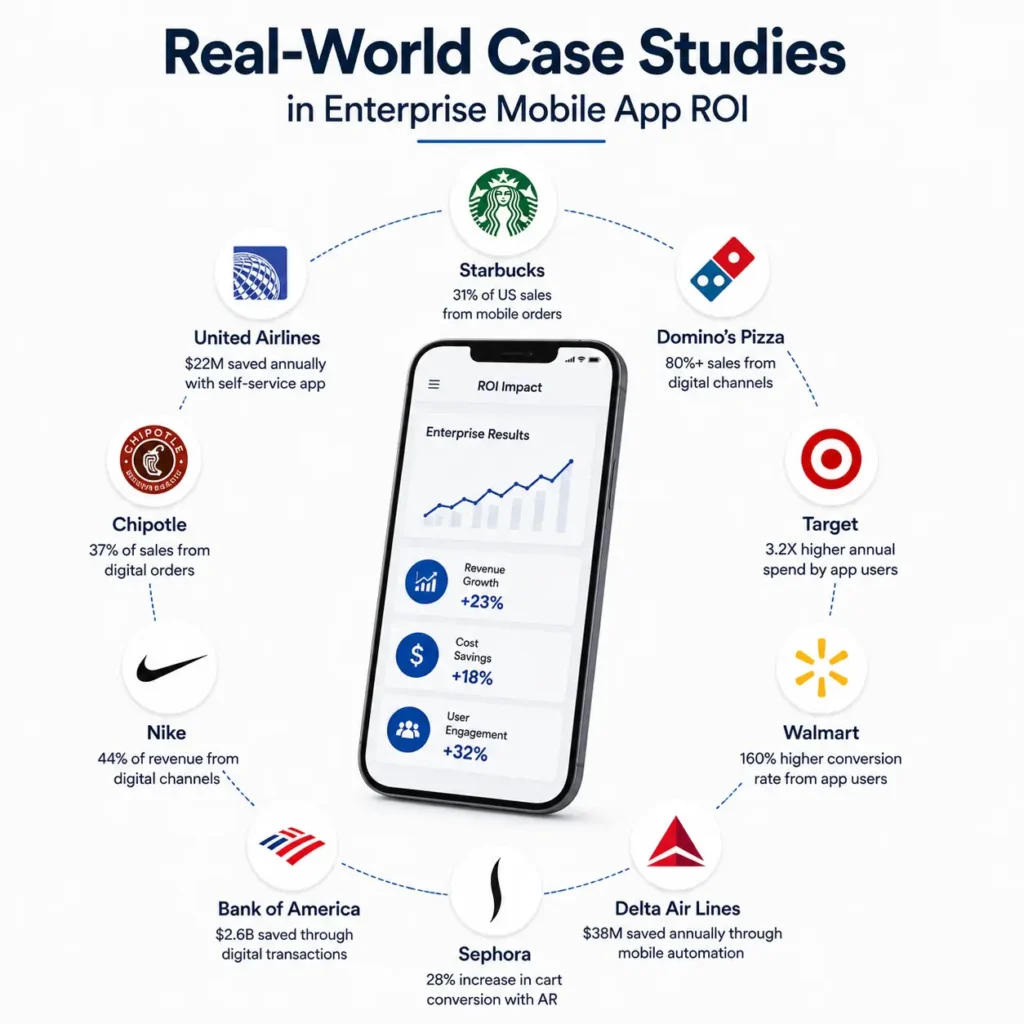
Verified industry data demonstrates how top brands transform mobile software into massive financial drivers. The following ten enterprise deployments show exact performance calculations, financial valuations, and documented return metrics.
1. Starbucks (Mobile Order & Pay System)
- Financial Metric: Mobile orders accounted for 31% of total US company-operated store sales in Q4 2023, up from 27% in previous cycles.
- Calculation: Adding mobile ordering increased order throughput during peak morning hours by 14%, adding over $1.2 billion in incremental annual revenue against an estimated initial $40 million digital system investment.
2. Domino’s Pizza (AnyWare Ordering Engine)
- Financial Metric: Digital channels generate over 80% of total US retail sales, driving global retail sales past $18 billion in annual volume.
- Calculation: Custom app ordering reduced order processing labor costs per store by $0.45 per transaction across 6,500 locations, yielding over $85 million in annual operational savings alongside revenue expansion.
3. Target (Circle App Integration)
- Financial Metric: Target Circle accumulated over 100 million active members, driving a 4.5% increase in average trip frequency for mobile users.
- Calculation: Mobile app members spend 3.2 times more annually ($1,400 average annual spend) compared to non-app shoppers ($437 average annual spend), multiplying long-term brand equity.
4. Walmart (In-Store Navigation & Scan & Go)
- Financial Metric: E-commerce sales grew 23% globally, heavily fueled by mobile app store pickup and scan features.
- Calculation: App users convert at a rate 160% higher than traditional mobile web visitors, cutting overall digital acquisition costs across retail categories.
5. Delta Air Lines (Fly Delta Platform)
- Financial Metric: Over 85% of active day-of-travel check-ins occur directly inside the native iOS and Android applications.
- Calculation: Automated mobile bag tracking and ticket rebooking eliminated $38 million in call center labor expenses annually, completing its mobile app payback period within 7 months of initial deployment.
6. Sephora (Beauty Insider & AR Try-On)
- Financial Metric: Mobile app users demonstrate a 2.5x higher repeat purchase rate within 90 days of download.
- Calculation: Integrating augmented reality product previews boosted cart conversions by 28%, increasing average order value from $58 to $74 per mobile transaction.
7. Bank of America (Erica Virtual Assistant & Mobile App)
- Financial Metric: 50 million active digital clients completed over 3 billion digital interactions in a single fiscal year.
- Calculation: Digitizing routine teller transactions through mobile deposit and AI chat reduced cost-per-transaction from $4.25 (in-branch teller) to $0.10 (mobile app), generating over $2.6 billion in multi-year operational cost reductions.
8. Nike (Nike App & SNKRS Platform)
- Financial Metric: Direct-to-consumer digital sales reached 44% of total brand revenues, driven by exclusive app releases.
- Calculation: Native app members generate 3x higher lifetime customer value compared to wholesale retail shoppers, while cutting wholesale distributor commission payouts by 15%.
9. Chipotle (Rewards & Mobile Order Drive-Thru)
- Financial Metric: Digital transactions account for 37% of total food and beverage revenue, representing over $3 billion in sales.
- Calculation: Dedicated mobile pickup lanes (Chipotlanes) increased store-level profit margins by 300 basis points due to higher order density and faster kitchen output without staff increases.
10. United Airlines (Customer Assistant App Features)
- Financial Metric: Self-service mobile features process over 68% of flight change requests during major weather delays.
- Calculation: Automating flight rebooking cut airport gate agent overtime payouts by $22 million annually while reducing passenger hotel compensation claims.
Comprehensive App Cost Benefit Analysis Strategies
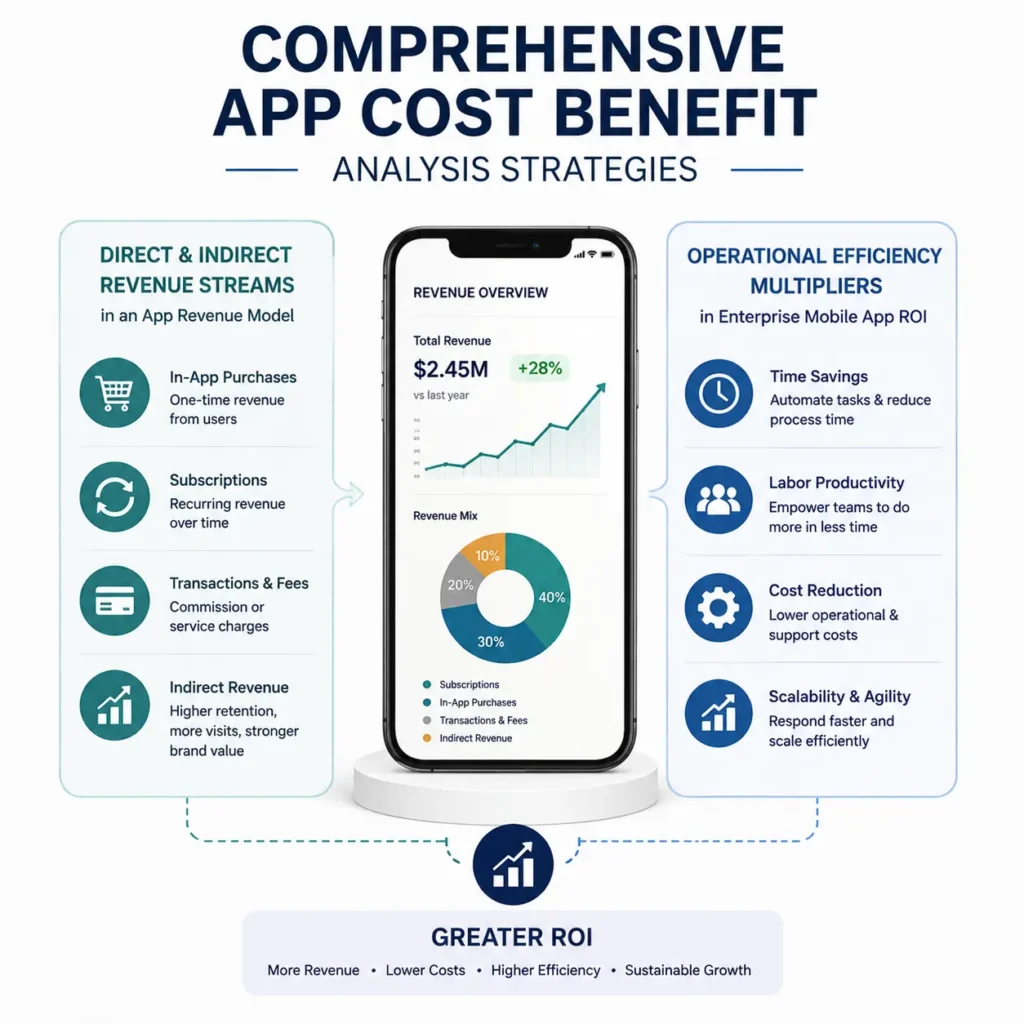
Quantifying digital performance requires looking beyond initial download counts. True financial valuation measures both top-line revenue generation and internal operational efficiency gains.
Direct and Indirect Revenue Streams in an App Revenue Model
A well-designed app revenue model captures direct income through in-app purchases, recurring subscription tiers, or transactional processing fees. Monetization strategy dictates overall platform valuation over time. Indirect financial value comes from higher brand retention, more frequent physical store visits, and fewer customer service tickets. Combining these streams provides a clear financial valuation for your digital product portfolio. These financial considerations should be evaluated alongside the broader development, architecture, and business requirements discussed in our custom mobile app development services guide.
Operational Efficiency Multipliers in Enterprise Mobile App ROI
Internal workforce applications deliver high financial returns by eliminating paper workflows. Enterprise mobile app ROI manifests through reduced task completion times, automated inventory checks, and immediate field communication. A custom mobile tool that saves 15 minutes daily for a field crew of 1,000 workers recovers thousands of billable labor hours every month.
Key Performance Benchmarks for Mobile App ROI Metrics
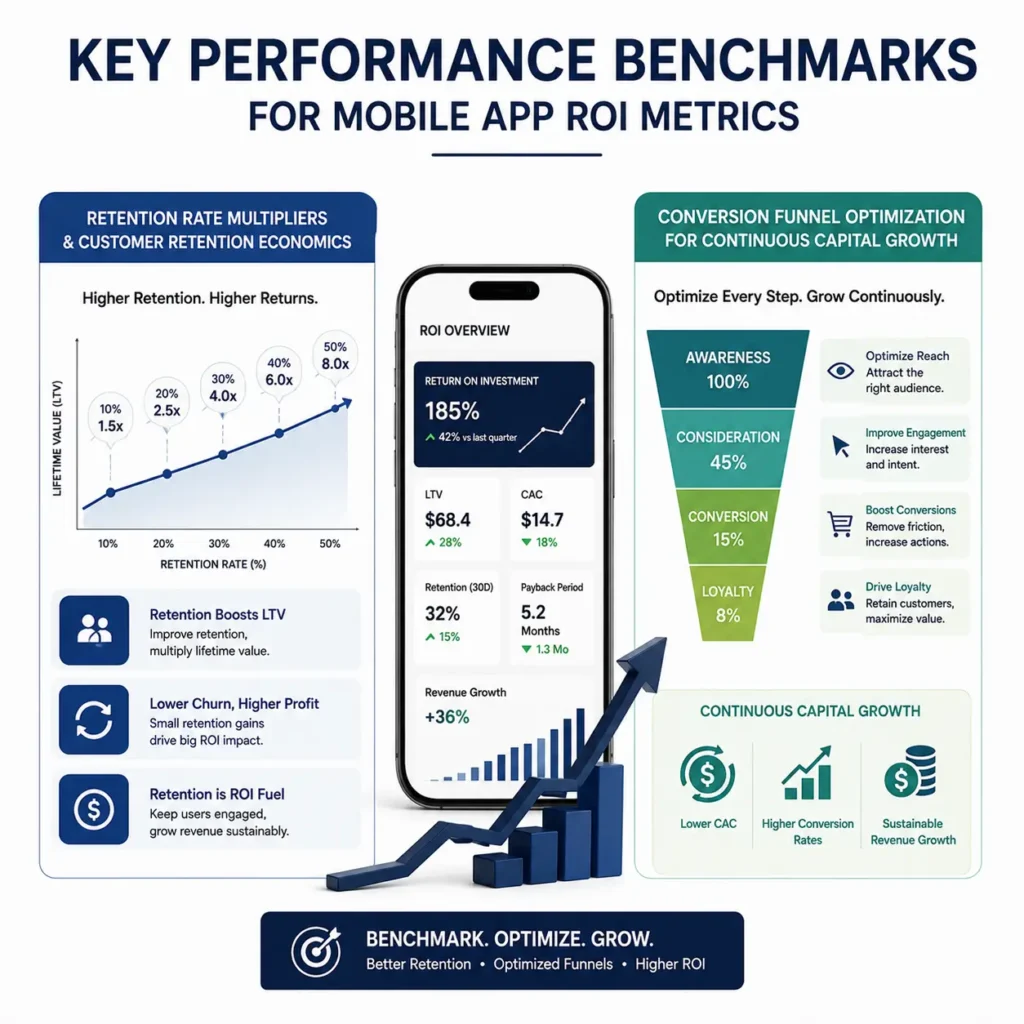
Tracking specific operational metrics guarantees your product maintains positive cash flow. Consistent analysis pinpoints conversion drop-offs and highlights opportunities to scale user revenue.
Retention Rate Multipliers and Customer Retention Economics
Keeping existing users active protects your initial acquisition budget. Industry research confirms that a 5% boost in user retention increases overall company profits by 25% to 95%. High user retention lowers your effective mobile app payback period because existing profiles generate continuous revenue without incurring secondary advertising costs.
Conversion Funnel Optimization for Continuous Capital Growth
Improving your in-app checkout conversion rate from 2% to 3% yields a 50% increase in gross digital revenue without spending another dollar on user acquisition. Fine-tuning checkout steps directly increases mobile application yield. Systematic UX auditing removes friction from registration forms, cart screens, and payment options.
Stop Wasting Budget on Apps People Delete
Building a mobile app is easy. Building one that actually makes money? That takes serious product strategy. At FlowmazeUX, we don’t just design pretty screens; we engineer high-converting digital products that maximize your bottom line, cut user churn, and hit real ROI metrics. Explore our custom mobile app development services to see how we turn product ideas into scalable, ROI-focused mobile experiences.
Frequently Ask Questions
Mobile app ROI measures the net financial return generated by a mobile application relative to its total costs, including design, development, infrastructure, and marketing expenses.
Divide total app development and launch expenses by average monthly net profits to determine the exact number of months needed to recover your initial capital investment.
Essential metrics include App Customer Lifetime Value (LTV), User Acquisition Cost (CAC), Monthly Active Users (MAU), Retention Rate, Average Revenue Per User (ARPU), and Conversion Rate.
A healthy ratio is 3:1 or higher, meaning a customer generates at least three times more revenue over their platform lifespan than the cost incurred to acquire them.
Enterprise apps generate high returns by automating internal operations, reducing human error, eliminating paper workflows, and saving billable employee time across large workforces.
An enterprise model accounts for initial development fees, cloud hosting, API integrations, maintenance retainers, marketing spend, direct sales revenue, and labor efficiency savings.
Acquiring new users costs five times more than retaining existing ones. High retention rates stabilize recurring revenue and shorten the platform payback period significantly.
Common causes include poor UI/UX design, high user drop-off rates, excessive user acquisition costs, slow load times, lack of monetization strategy, and high ongoing bug maintenance fees.